Calculate ocean wave parameters using spectral analysis methods
Source:R/waveStatsSP.R
waveStatsSP.RdCalculate ocean wave parameters using spectral analysis methods
waveStatsSP(data, Fs, method = c("welchPSD", "spec.pgram"),
  plot = FALSE, kernel = NULL, segments = NULL, ...)
Arguments
| data | A vector of surface heights that constitute a time series of observations. Typical units = meters. |
|---|---|
| Fs | Sampling frequency of the surface heights data. Units = Hz, i.e. samples per second. |
| method | A character string indicating which spectral analysis method
should be used. Choose one of |
| plot | A logical value denoting whether to plot the spectrum. Defaults
to |
| kernel | An object of class |
| segments | Numeric value indicating the number of windowing segments to
use with |
| ... | Additional arguments to be passed to spectral analysis functions,
such as the |
Value
List of wave parameters based on spectral methods.
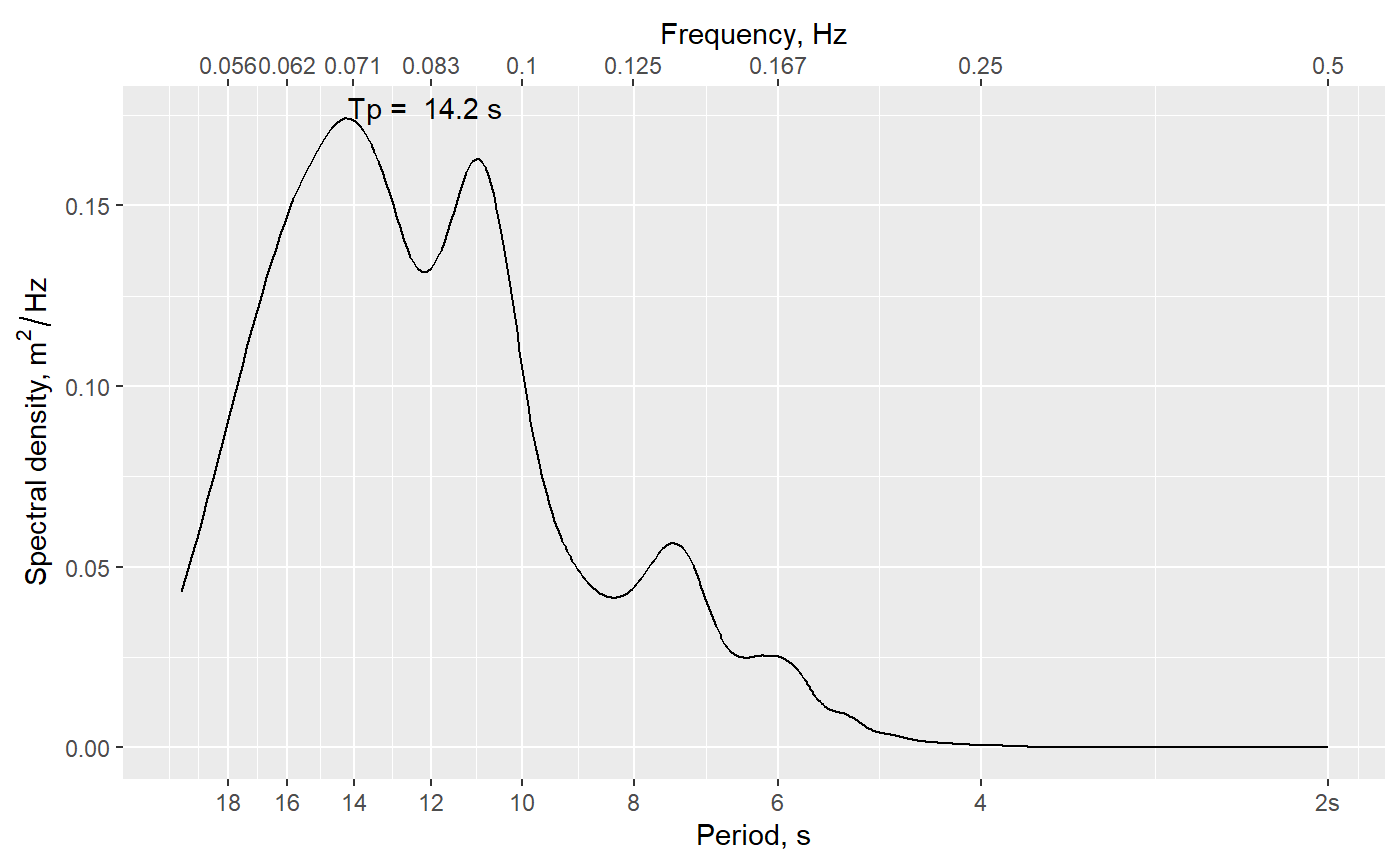
hAverage water depth. Same units as input surface heights (typically meters).Hm0Significant wave height based on spectral moment 0. Same units as input surface heights (typically meters). This is approximately equal to the average of the highest 1/3 of the waves.TpPeak period, calculated as the frequency with maximum power in the power spectrum. Units of seconds.m0Estimated variance of time series (moment 0).T_0_1Average period calculated as \(m0/m1\), units seconds. Follows National Data Buoy Center's method for average period (APD).T_0_2Average period calculated as \((m0/m2)^0.5\), units seconds. Follows Scripps Institution of Oceanography's method for calculating average period (APD) for their buoys.EPS2Spectral width parameter.EPS4Spectral width parameter.
Details
Carries out spectral analysis of ocean wave height time series to estimate common wave height statistics, including peak period, average period, and significant wave height.
References
Original MATLAB function by Urs Neumeier: http://neumeier.perso.ch/matlab/waves.html, based on code developed by Travis Mason, Magali Lecouturier and Urs Neumeier.
See also
waveStatsZC for wave statistics determined using a
zero-crossing algorithm.
Examples
#> $h #> [1] 10.45138 #> #> $Hm0 #> [1] 0.4146835 #> #> $Tp #> [1] 14.17323 #> #> $m0 #> [1] 0.01074765 #> #> $T_0_1 #> [1] 10.47688 #> #> $T_0_2 #> [1] 9.782931 #> #> $EPS2 #> [1] 0.3832773 #> #> $EPS4 #> [1] 0.6402274 #>