Correct for depth attenuation of a water surface height pressure signal.
Source:R/prCorr.R
prCorr.RdBottom-mounted pressure transducers suffer from pressure signal attenuation when attempting to estimate surface wave heights. This function corrects water surface height time series based on the depth of the water column and height of the sensor above the bottom.
prCorr(pt, Fs, zpt, M = 512, CorrLim = c(0.05, 0.33), plot = FALSE)
Arguments
| pt | A vector of sea surface elevations (units of meters). |
|---|---|
| Fs | Sampling frequency (units of Hz). Normally 4 Hz for an OWHL logger. |
| zpt | Height of the pressure sensor above the seabed (units of meters). |
| M | Length of time series segments that will be used in the detrending and attenuation correction operations. 512 samples is the default, should be an even number. |
| CorrLim | [min max] frequency for attenuation correction (Hz, optional, default [0.05 0.33], which translate to periods of 20 sec to 3 sec). |
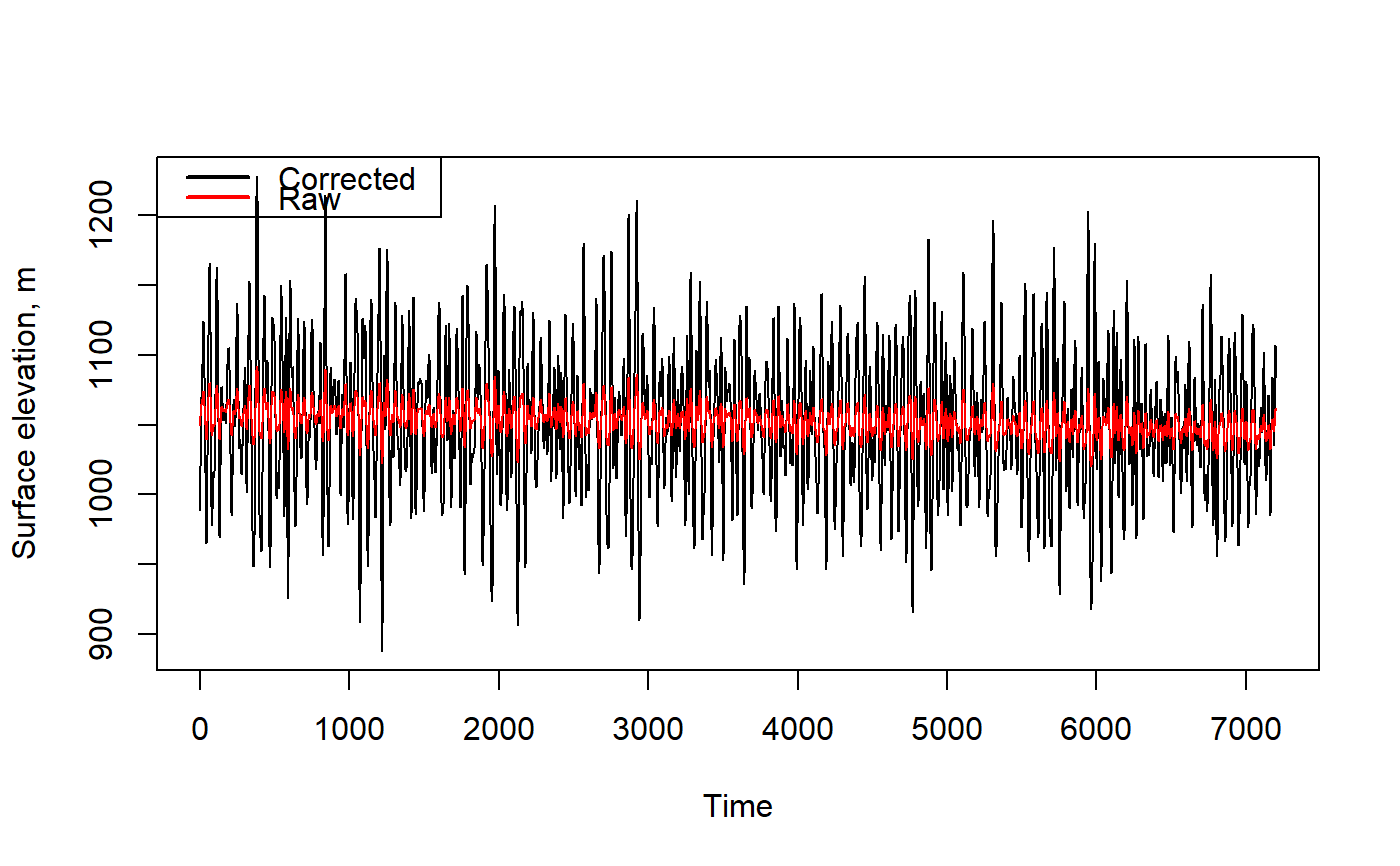
| plot | Logical value TRUE or FALSE. Displays a plot of the original and corrected time series. |
Value
A vector of the depth-corrected surface heights (units of meters usually). Any original trend in the input data (such as tide change) is present in the output data. The returned surface height fluctuations will typically be more extreme than the raw input surface heights.
References
Based on original MATLAB function by developed by Travis Mason, M. Lecouturier & Urs Neumeier http://neumeier.perso.ch/matlab/waves.html
Each segment of pt will be linearly detrended, corrected for attenuation, and the linear trend will be added back to the returned data.
Examples
data(wavedata)
corrected = prCorr(wavedata$swPressure.mbar, Fs = 4, zpt = 0.1)
# Plot the results
corrected = prCorr(wavedata$swPressure.mbar, Fs = 4, zpt = 0.1, plot=TRUE)